Education analytics
See what is slipping before the term ends.
Problems usually surface after the damage is done: attendance has dropped, fees are unpaid, results have slid. Scholva brings the numbers from every module together, so you notice a falling attendance line this week rather than at the next parent meeting.
- Free for up to 200 students
- No credit card required
- iPhone, Android and web
What Analytics takes off your plate.
The everyday work this module handles, and the details that come with it.
Trends
Attendance falling in a section or dues rising in a grade shows up on your dashboard as the pattern forms, not weeks later.
Comparisons
Compare sections, batches and years side by side, and see which groups need attention.
Live dashboards
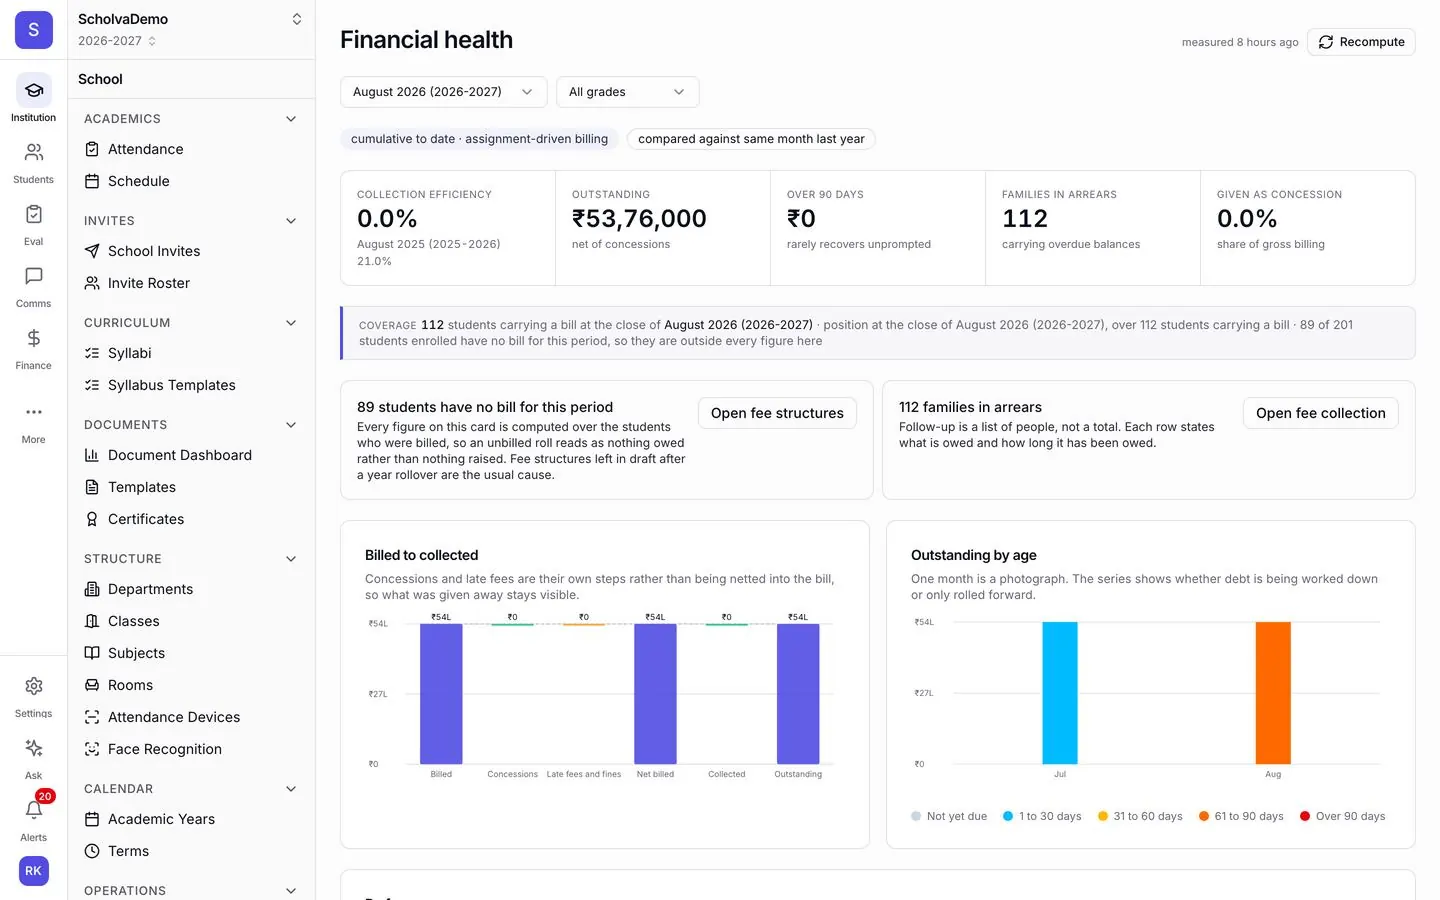
Today's attendance, this month's collection and this term's results are there when you open the page. Nobody has to compile a report.
Fee recovery
Outstanding amounts by age and families in arrears, so reminders go to the right people at the right time.
Cross-module reports
Pull academics, fees, transport and assessments into one report and export it to PDF or Excel for your board meeting.
Early warnings
The system flags what needs attention, such as low attendance in a class or collection behind plan. You decide what to do about it.
Also included
- Custom report builder
- Scheduled email reports
- CSV
- PDF and Excel export
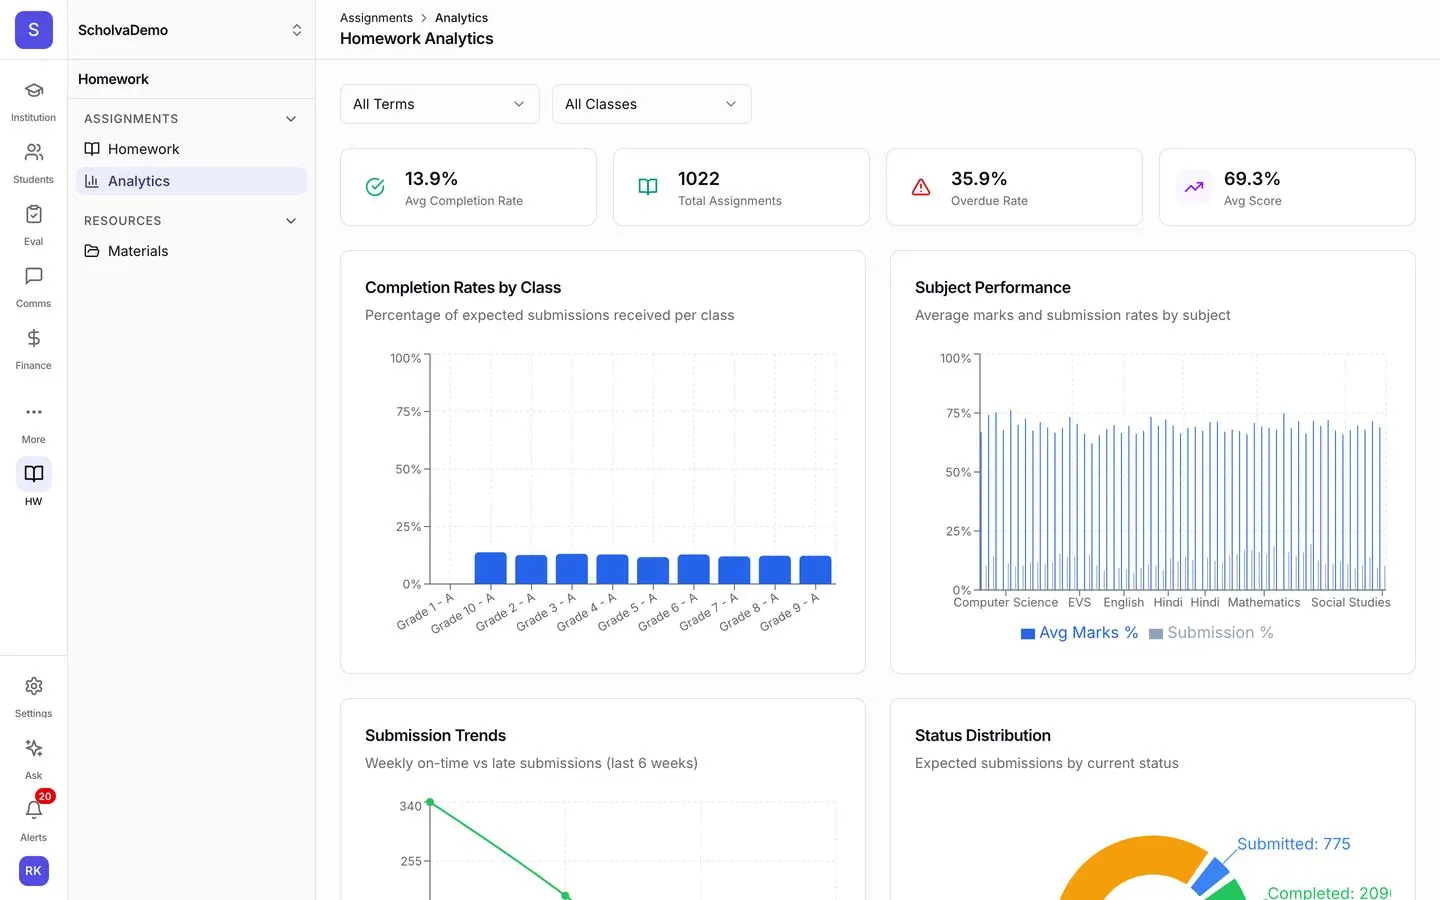
- Homework analytics
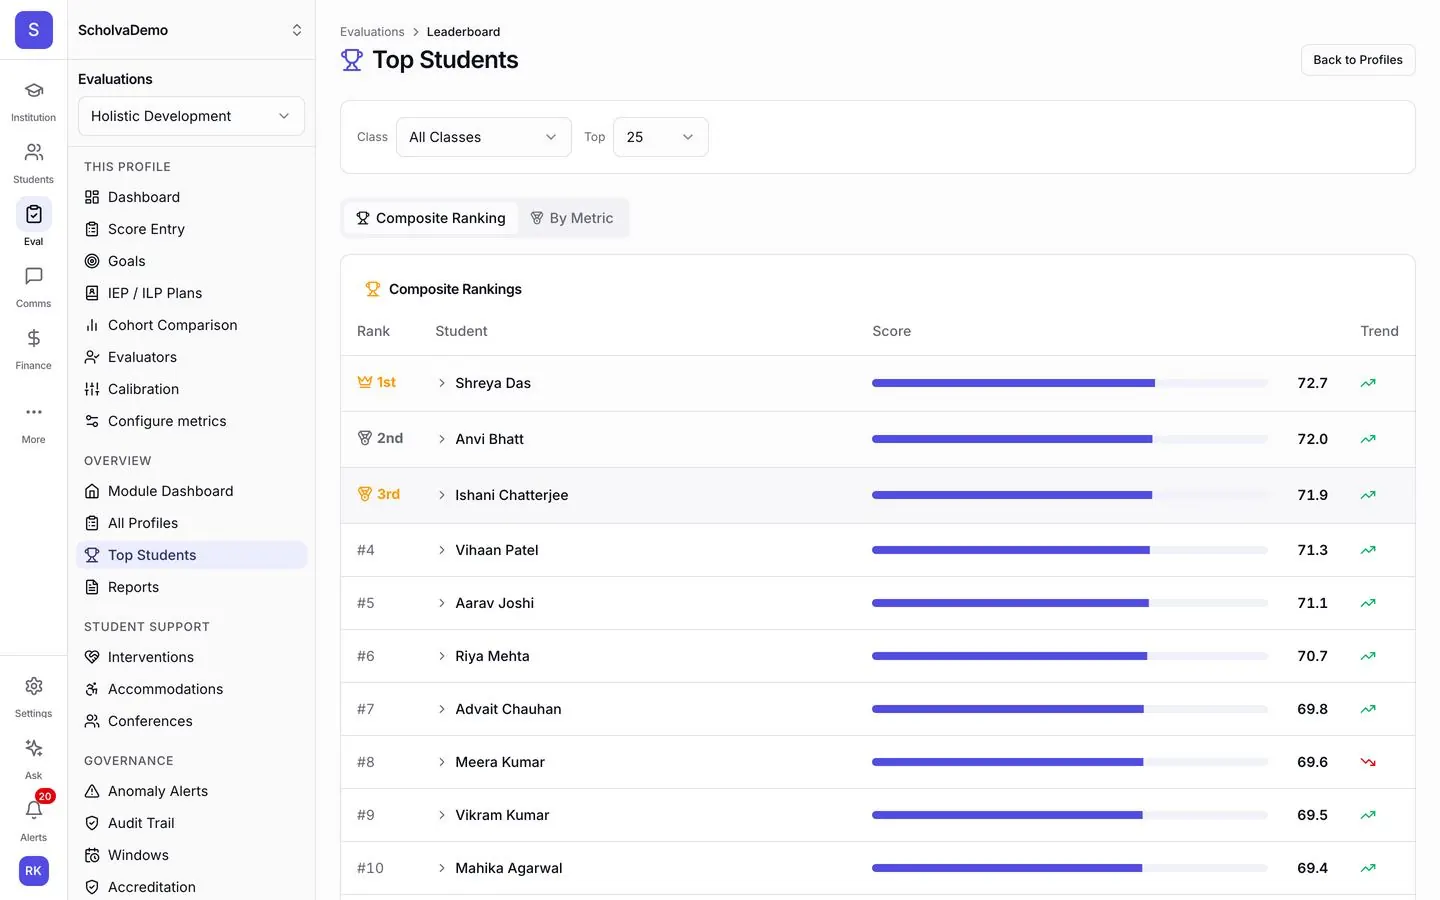
- Top student rankings
- API access for custom integrations
How it works
Up and running in 3 steps.
Our team helps you set up and import your data, then the module runs as part of the everyday work.
Data arrives on its own
Attendance, marks, payments and trips recorded in Scholva feed the dashboards as they happen. No separate setup.
Explore the dashboards
Start from ready-made dashboards and filter by date, grade, section or your own dimensions.
Act on what you see
Get alerts for unusual changes, share reports with your team and follow up where it matters.
Connected by design.
Analytics reads from every Scholva module, including Academics, Transport, Fees, Assessments and Portals, to give one view of how the school is running.
Explore other modules
14 modules, one shared record.
Visitor Management
Gate passes with photo capture, host notifications and blacklist alerts.
Learn moreInventory
Tag every asset, track consumables and vendors, and raise purchase orders.
Learn moreAlumni
A graduate directory, event RSVPs, donations and record verification.
Learn moreBehavior & Discipline
Log incidents in minutes, track resolutions, notify parents and follow up with support plans.
Learn moreQuestions, answered.
What schools usually ask about Analytics. Anything else, our team is happy to help.
Spot problems while there is still time.
Free for up to 200 students. Our team helps you set up, import your data and train your staff.